The IPCC* was set up in 1988 with a mandate to assess the scientific, technical and socio-economic information available on climate change in a non-partisan, methodical and objective way. The latest report, published in March 2023, highlights the extent of global warming and the need to adapt to the expected changes, which are assessed on the basis of several scenarios.
Our project ClimAtlas
As part of its RSE certification, the DataLab Groupe is strengthening the alignment of its achievements with the Group’s societal commitments. To help raise awareness of the concrete consequences of climate change, the Group’s DataLab has developed ClimAtlas.
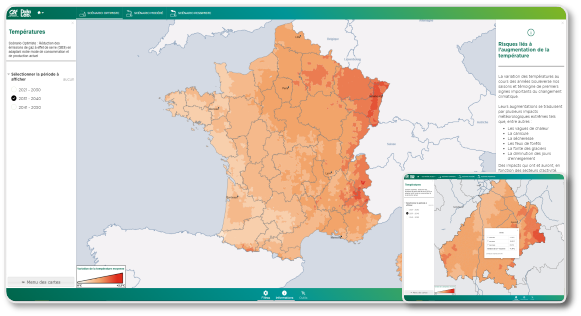
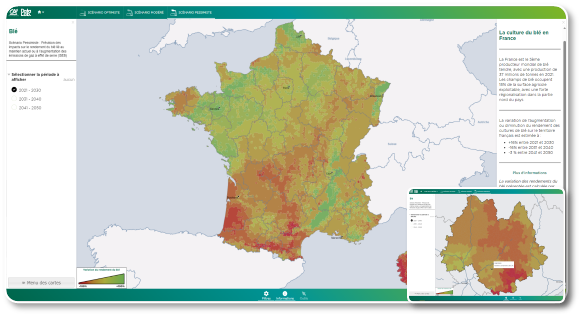
Built from weather forecasts made available in Open Data by Météo-France and the DSSAT tool (agricultural yield reference), it enables to display a set of web maps showing the projection at national and local level of the changes corresponding to the different IPCC scenarios and the resulting risks to be visualized quickly on a set of web maps.
Based on 10,000 data points across France, ClimAtlas aggregates all the data to provide a projection of these changes at municipal level. At this stage, the Minimum Viable Product shows projected changes in several indicators over the next three decades for each IPCC scenario.
These projections are compared with the reference period, also recommended by Météo-France (30-year average between 1976 and 2005) to assess climate change and its impacts:
- Meteorological indicators: temperature, precipitation, heatwaves and intense precipitation.
- Yield indicators for the most important crops: wheat, maize and potatoes at present


ClimAtlas is designed to raise collective awareness of the impact of climate change and, over and above the essential need to reduce our greenhouse gas emissions in order to limit them, the need to anticipate adaptations and support our customers in making them.
The Next Steps
ClimAtlas could eventually help employees in contact with customers, as well as those in charge of support or central functions (real estate, risk, ESG, etc.).
Adding new indicators on the occurrence of natural disasters (drought, forest fires, floods, etc.) and on the yield of other crops (sunflower, barley, etc.) is already under consideration, in order to broaden the visualization of the impacts of climate change.
Images’ licenses:
- RawPixel.com, CC0 1.0 DEED, https://www.rawpixel.com/image/6016080
- Denys, CC-BY-3.0, https://commons.wikimedia.org/wiki/File:RT_2005_zone_climatique.svg
*(Intergovernmental Panel on Climate Change)